Migrating winIDEA workspace from 9.17 and older to 9.21 and above - transition guide
When transitioning from older winIDEA versions to the latest (9.21 and above), you may encounter challenges due to significant changes in configuration and debugging processes. This how-to provides an overview of the migration process, highlighting recommended steps.
The most significant changes are:
- Multi-memory space workspace (MMS)
- Separate configuration for each application, allowing dynamic debugging context switching
- Applications run in distinct Memory Spaces with unique IDs
- Symbol files are application-specific for debugging activities
- Clear distinction between Symbol File (used by winIDEA to load debug symbols) and Program File (used to program the memory on the SoC).
You can find a more detailed description in the topic Session Configuration.
Possible issues
- Mixed Program and Symbol Files during conversion
- Core-specific settings in Hardware | CPU Options | Cores
- Incorrect creation/mapping of Memory Spaces
- Corruption of workspace files, or global files used across different winIDEA versions
- Infineon AURIX T2xx/TC3xx: core synchronization options and peripheral suspension
Perform clean-up of the common files and create a new workspace
Although automatic workspace conversion works in most cases. winIDEA updates and inadvertent corruption of some global files (or the workspace files) may cause some unexpected behavior.
1. Close all winIDEA versions.
2. Open Windows Explorer, type in %appdata%, and hit Enter. Navigate to the folders listed below and delete the contents:
- %USERPROFILE%/AppData/Roaming/ASYST/winIDEA
- %USERPROFILE%/AppData/Local/iSYSTEM/winIDEA
3. Download the latest winIDEA build.
4. Create a new workspace.
Make sure to tick the Take me there after wizard checkbox, so you can configure the advanced settings as well.
Configure the Application(s)
You should create all the different applications to be debugged (e.g. if some application cores are running an OS, we will have one application for that, if the cores are running different applications we should define a separate application for each core, for example, App_HSM is a separate application running only in the HSM memory space).
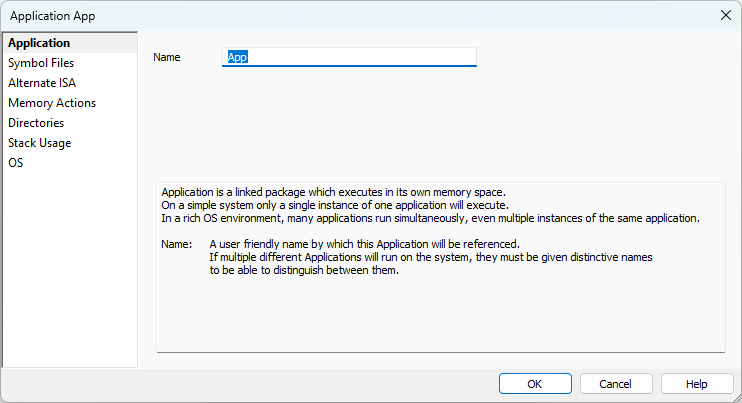
1. Open Debug | Configure Session | Switch to Full | Applications | Application and determine a suitable name for the application(s).
2. On the Symbol Files page, define the files that contain the debug symbols for the debugged application.
If there are multiple symbol files (e.g. bootloader and application) you can specify which symbol file should be the default file for debugging. For each file, we can specify additional options (depending on the file format).
3. (optional) Correctly locate the source files for debugging via the Directories page.
You can use these options in case you want to do source-level debugging, set breakpoints in .c files, etc., and where the application is built on a different PC from where it is debugged. Refer to Locating the source code for more information.
4. (optional) On the OS page, specify OS awareness and configure the necessary ORTI or profiler.xml files.
Configure SoC
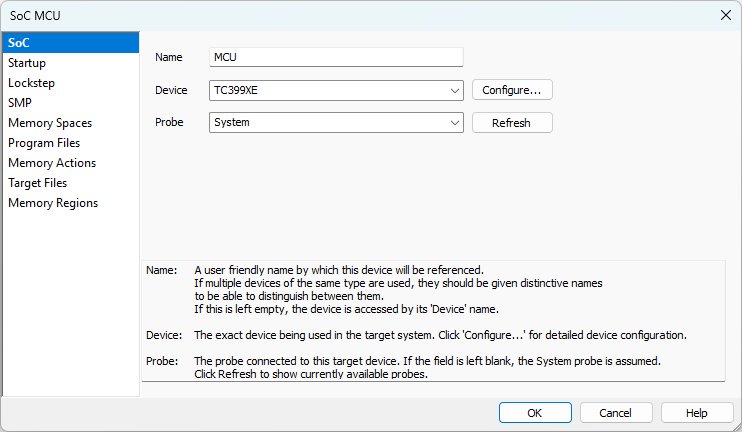
The wizard creates the default configuration when you create a new workspace. The SoC dialog via Debug | Configure Session | Switch to Full | SoCs allows you to configure advanced options manually.
1. Select the SoC (named MCU by default) and click Edit.
2. On the SoC page specify the SoC name, the device, and the Probe being used for debugging.
- System - if you are connecting the BlueBox directly to the target via a debug adapter, or
- Active Probe if you are connected with one
Leaving the field empty defaults to the System.
3. Define operations on the debug session startup on the Startup page.
For example:
- Set the Verify option, or
- Configure whether or how the Target Download should be executed after the regular Download.
4. (optional) Configure the Lockstep page.
If you have any cores running in lockstep (this mostly pertains to Cortex-A clusters where lockstep is configurable. If the SoC features a non-configurable lockstep configuration it should not be specified here).
5. (optional) On the SMP page, specify SMP bindings.
This is intended in use cases where multiple cores execute the same application (such as an OS). Depending on the application, we can select multiple bindings, and assign different cores to them.
6. Define Memory spaces.
A Memory Space is assigned to a core or an SMP binding. Within it, virtual (core) memory accesses are separated from other memory spaces by hardware logic. In each memory space, one application is executed. For example, if two applications are defined, App and App_HSM, you need two memory spaces to assign these applications to.
Note that, if a memory space is disabled (unchecked) it means we will not be able to debug the application assigned to it (no debug symbols will be loaded for that application).
7. On the Program Files page specify all the program files which have the actual code you want to program to the target's memory.
winIDEA will combine these files in a single image (while checking for overlap) and program the target with this image. For each file, you can define different options (offset, override file format, etc.)
8. (optional) Add files on the Target Files page you want to download during an active debug session.
Regular Download implies a reset and a new debug session.
Review CPU-specific and hardware settings
The option Diff Config to Clipboard can help you identify all configurations under the Hardware menu.
1. Navigate to Hardware | CPU Options.
2. On the Reset page specify what happens when a Reset occurs.
For example, whether it is triggered by the debugger or externally but still visible on the reset line.
For more details on how the debug session initialization is executed (e.g. what is done before Programming, the start of a debug session, or before attaching to a running target) please refer to the Initialization Sequence topic.
3. On the Debugging page, you can turn on the global flag for core synchronization.
After you can select for each core whether it should be synchronized or not), define whether/how to use the Image Checker etc.
4. On the Hardware page, define IO voltage levels.
5. On the JTAG | Nexus pages configure the signal properties for the debug/trace port.
6. On the Analyzer page, configure the on-chip trace module.
7. On the SoC Advanced page, configure SoC-specifics.
8. Configure the SoC page.
For example, specify whether a Low-power debug mode is required (as it requires some special handling).
9. On the Cores: <coreID> page, set the core-specific option for each of the cores featured on the SoC.
The most important options are:
- will the core be observed or debugged
- will the core be synchronized
- what should be done with the core at the debug entry, i.e. (preset PC to the entry point specified in the .elf, or a specific address).