winIDEA Callstack: Issues with display
The Callstack Window doesn't show current call stack content or the displayed info is incorrect.
Possible solutions
Compiler optimization
The compiler can optimize the code to the extent that the required information being used by the debugger to extract the Call Stack context is not available or just not sufficient. Check the compiler manual for any relevant compiler switches and try to decrease compiler optimization level(s) - at least for the test to confirm that this is the root cause for Call Stack not being displayed properly.
Call Stack Generation
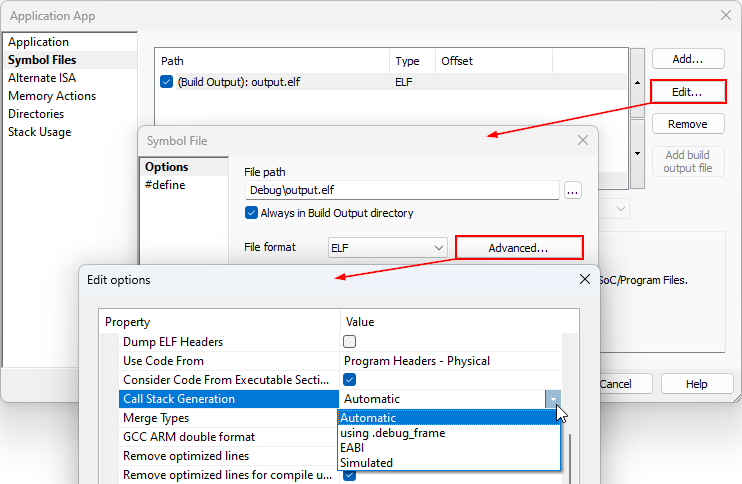
Call Stack can be generated using information from different sources: ELF file, CPU EABI, or by code simulation.
Automated is the default option and winIDEA will automatically determine the best method.
1. Open Debug | Configure Session | Applications | Symbol Files.
2. Select the download file and press Edit.
3. Click Advanced to open the Edit Options dialog.
4. From the drop-down Call Stack Generation field select:
- EABI - Call Stack is generated as specificated in the EABI documentation for specific architecture.
- using .debug_frame - ELF debug_frame section will be used to unwind the stack.
- Simulated - Call Stack is reconstructed by using object-code simulation.

ARM Cortex-M
Check the topic How to get maximum Call Stack information?
Same category topics
- Infineon AURIX TC2xx/TC3xx: From INI files to winIDEA settings - synchronization & peripheral suspension configuration guide
- emuSync: Synchronizing parallel processors under winIDEA control
- winIDEA: Reach maximum flash programming performance
- Infineon AURIX: Cannot step over function
- Extracting SFRs when launching winIDEA